Financial Data Storage
In Algorithmic Trading the spotlight usually shines on the alpha model component of the full trading system. This component generates the trading signals, prior to filtration by a risk management and portfolio construction system. As such, algo traders often spend a significant portion of their research time refining the alpha model in order to optimise one or more metrics prior to deployment of the strategy into production.
However, an alpha model is only as good as the data being fed into it. This concept is nicely characterised by the old computer science adage of “garbage in, garbage out.” It is absolutely crucial that accurate, timely data is used to feed the alpha model. Otherwise results will be at best poor or at worst completely incorrect. This will lead to significant underperformance when system is deployed live.
In this chapter we will discuss issues surrounding the acquisition and provision of timely accurate data for an algorithmic strategy backtesting system and ultimately a trading execution engine. In particular we will study how to obtain financial data and how to store it. Subsequent chapters will discuss how to clean it and how to export it. In the financial industry this type of data service is known as a securities master database.
1.) Securities Master Databases
A securities master is an organisation-wide database that stores fundamental, pricing and transactional data for a variety of financial instruments across asset classes. It provides access to this information in a consistent manner to be used by other departments such as risk management, clearing/settlement and proprietary trading.
In large organisations a range of instruments and data will be stored. Here are some of the instruments that might be of interest to a firm:
- Equities
- Equity Options
- Indices
- Foreign Exchange
- Interest Rates
- Futures
- Commodities
- Bonds – Government and Corporate • Derivatives – Caps, Floors, Swaps
Securities master databases often have teams of developers and data specialists ensuring high availability within a financial institution. While this is necessary in large companies, at the retail level or in a small fund a securities master can be far simpler. In fact, while large securities masters make use of expensive enterprise database and analysis systems, it is possibly to use commodity open-source software to provide the same level of functionality, assuming a well-optimised system.
2.) Financial Datasets
For the retail algorithmic trader or small quantitative fund the most common data sets are endof-day and intraday historical pricing for equities, indices, futures (mainly commodities or fixed income) and foreign exchange (forex). In order to simplify this discussion we will concentrate solely on end-of-day (EOD) data for equities, ETFs and equity indices. Later sections will discuss adding higher frequency data, additional asset classes and derivatives data, which have more advanced requirements.
EOD data for equities is easy to obtain. There are a number of services providing access for free via web-available APIs:
- Yahoo Finance – http://finance.yahoo.com
- Google Finance – https://www.google.com/finance
- QuantQuote – https://www.quantquote.com (S&P500 EOD data only)
- EODData – http://eoddata.com (requires registration)
It is straightforward to manually download historical data for individual securities but it becomes time-consuming if many stocks need to be downloaded daily. Thus an important component of our securities master will be automatically updating the data set.
Another issue is look-back period. How far in the past do we need to go with our data? This will be specific to the requirements of your trading strategy, but there are certain problems that span all strategies. The most common is regime change, which is often characterised by a new regulatory environment, periods of higher/lower volatility or longer-term trending markets. For instance a long-term short-directional trend-following/momentum strategy would likely perform very well from 2000-2003 or 2007-2009. However it would have had a tough time from 2003-2007 or 2009 to the present.
My rule of thumb is to obtain as much data as possible, especially for EOD data where storage is cheap. Just because the data exists in your security master, does not mean it must be utilised. There are caveats around performance, as larger database tables mean longer query times (see below), but the benefits of having more sample points generally outweighs any performance issues.
As with all financial data it is imperative to be aware of errors, such as incorrect high/low prices or survivorship bias.
3.) Storage Formats
There are three main ways to store financial data. They all possess varying degrees of access, performance and structural capabilities. We will consider each in turn.
3.1] Flat-File Storage:
The simplest data store for financial data, and the way in which you are likely to receive the data from any data vendors, is the flat-file format. Flat-files often make use of the Comma-Separated Variable (CSV) format, which store a two-dimensional matrix of data as a series of rows, with column data separated via a delimiter (often a comma, but can be whitespace, such as a space or tab). For EOD pricing data, each row represents a trading day via the OHLC paradigm (i.e. the prices at the open, high, low and close of the trading period).
The advantage of flat-files are their simplicity and ability to be heavily compressed for archiving or download. The main disadvantages lie in their lack of query capability and poor performance for iteration across large datasets. SQLite and Excel mitigate some of these problems by providing certain querying capabilities.
3.2] Document Stores/NoSQL:
Document stores/NoSQL databases, while certainly not a new concept, have gained significant prominence in recent years due to their use at “web-scale” firms such as Google, Facebook and Twitter. They differ substantially from RDBMS systems in that there is no concept of table schemas. Instead, there are collections and documents, which are the closest analogies to tables and records, respectively. A wide taxonomy of document stores exist, the discussion of which is well outside this chapter! However, some of the more popular stores include MongoDB, Cassandra and CouchDB.
Document stores, in financial applications, are mostly suited to fundamental or meta data. Fundamental data for financial assets comes in many forms, such as corporate actions, earnings statements, SEC filings etc. Thus the schema-less nature of NoSQL DBs is well-suited. However, NoSQL DBs are not well designed for time-series such as high-resolution pricing data and so we won’t be considering them further in this chapter.
3.3] Relational Database Management Systems:
A relational database management system (RDBMS) makes use of the relational model to store data. These databases are particular well-suited to financial data because different “objects” (such as exchanges, data sources, prices) can be separated into tables with relationships defined between them.
RDBMS make use of Structured Query Language (SQL) in order to perform complex data queries on financial data. Examples of RDBMS include Oracle, MySQL, SQLServer and PostgreSQL.
The main advantages of RDBMS are their simplicity of installation, platform-independence, ease of querying, ease of integration with major backtest software and high-performance capabilities at large scale (although some would argue the latter is not the case!). Their disadvantages are often due to the complexity of customisation and difficulties of achieving said performance without underlying knowledge of how RDBMS data is stored. In addition, they possess semirigid schemas and so data often has to be modified to fit into such designs. This is unlike NoSQL data stores, where there is no schema.
For all of the future historical pricing implementation code in the book we will make use of the MySQL RDBMS. It is free, open-source, cross-platform, highly robust and its behaviour at scale is well-documented, which makes it a sensible choice for quant work.
4.) Historical Data Structure
There is a significant body of theory and academic research carried out in the realm of computer science for the optimal design for data stores. However, we won’t be going into too much detail as it is easy to get lost in minutiae! Instead I will present a common pattern for the construction of an equities security master, which you can modify as you see fit for your own applications.
The first task is to define our entities, which are elements of the financial data that will eventually map to tables in the database. For an equities master database I foresee the following entities:
- Exchanges – What is the ultimate original source of the data?
- Vendor – Where is a particular data point obtained from?
- Instrument/Ticker – The ticker/symbol for the equity or index, along with corporate information of the underlying firm or fund.
- Price – The actual price for a particular security on a particular day.
- Corporate Actions – The list of all stock splits or dividend adjustments (this may lead to one or more tables), necessary for adjusting the pricing data.
- National Holidays – To avoid mis-classifying trading holidays as missing data errors, it can be useful to store national holidays and cross-reference.
There are significant issues with regards to storing canonical tickers. I can attest to this from first hand experience at a hedge fund dealing with this exact problem! Different vendors use different methods for resolving tickers and thus combining multiple sources for accuracy. Further, companies become bankrupt, are exposed to M&A activity (i.e. become acquired and change names/symbols) and can have multiple publicly traded share classes. Many of you will not have to worry about this because your universe of tickers will be limited to the larger index constituents (such as the S&P500 or FTSE350).
5.) Data Accuracy Evaluation
Historical pricing data from vendors is prone to many forms of error:
- Corporate Actions – Incorrect handling of stock splits and dividend adjustments. One must be absolutely sure that the formulae have been implemented correctly.
- Spikes – Pricing points that greatly exceed certain historical volatility levels. One must be careful here as these spikes do occur – see the May Flash Crash for a scary example. Spikes can also be caused by not taking into account stock splits when they do occur. Spike filter scripts are used to notify traders of such situations.
- OHLC Aggregation – Free OHLC data, such as from Yahoo/Google is particular prone to ’bad tick aggregation’ situations where smaller exchanges process small trades well above the ’main’ exchange prices for the day, thus leading to over-inflated maxima/minima once aggregated. This is less an ’error’ as such, but more of an issue to be wary of.
- Missing Data – Missing data can be caused by lack of trades in a particular time period (common in second/minute resolution data of illiquid small-caps), by trading holidays or simply an error in the exchange system. Missing data can be padded (i.e. filled with the previous value), interpolated (linearly or otherwise) or ignored, depending upon the trading system.
Many of these errors rely on manual judgement in order to decide how to proceed. It is possible to automate the notification of such errors, but it is much harder to automate their solution. For instance, one must choose the threshold for being told about spikes – how many standard deviations to use and over what look-back period? Too high a stdev will miss some spikes, but too low and many unusual news announcements will lead to false positives. All of these issues require advanced judgement from the quant trader.
It is also necessary to decide how to fix errors. Should errors be corrected as soon as they’re known, and if so, should an audit trail be carried out? This will require an extra table in the DB. This brings us to the topic of back-filling, which is a particularly insidious issue for backtesting. It concerns automatic correction of bad data upstream. If your data vendor corrects a historical error, but a backtested trading strategy is in production based on research from their previous bad data then decisions need to be made regarding the strategy effectiveness. This can be somewhat mitigated by being fully aware of your strategy performance metrics (in particular the variance in your win/loss characteristics for each trade). Strategies should be chosen or designed such that a single data point cannot skew the performance of the strategy to any great extent.
6.) Automation
The benefit of writing software scripts to carry out the download, storage and cleaning of the data is that scripts can be automated via tools provided by the operating system. In UNIX-based systems (such as Mac OSX or Linux), one can make use of the crontab, which is a continually running process that allows specific scripts to be executed at custom-defined times or regular periods. There is an equivalent process on MS Windows known as the Task Scheduler.
A production process, for instance, might automate the download all of the S&P500 endof-day prices as soon as they’re published via a data vendor. It will then automatically run the aforementioned missing data and spike filtration scripts, alerting the trader via email, SMS or some other form of notification. At this point any backtesting tools will automatically have access to recent data, without the trader having to lift a finger! Depending upon whether your trading system is located on a desktop or on a remote server you may choose however to have a semi-automated or fully-automated process for these tasks.
7.) Data Availability
Once the data is automatically updated and residing in the RDBMS it is necessary to get it into the backtesting software. This process will be highly dependent upon how your database is installed and whether your trading system is local (i.e. on a desktop computer) or remote (such as with a co-located exchange server).
One of the most important considerations is to minimise excessive Input/Output (I/O) as this can be extremely expensive both in terms of time and money, assuming remote connections where bandwidth is costly. The best way to approach this problem is to only move data across a network connection that you need (via selective querying) or exporting and compressing the data.
Many RDBMS support replication technology, which allows a database to be cloned onto another remote system, usually with a degree of latency. Depending upon your setup and data quantity this may only be on the order of minutes or seconds. A simple approach is to replicate a remote database onto a local desktop. However, be warned that synchronisation issues are common and time consuming to fix!
8.) MySQL for Securities Masters
Now that we have discussed the idea behind a security master database it’s time to actually build one. For this we will make use of two open source technologies: the MySQL database and the Python programming language. At the end of this chapter you will have a fully fledged equities security master with which to conduct further data analysis for your quantitative trading research.
8.1] Installing MySQL:
Installation of MySQL within Ubuntu is straightforward. Simply open up a terminal and type the following: ( sudo apt-get install mysql-server )
Eventually, you will be prompted for a root password. This is your primary administration password so do not forget it! Enter the password and the installation will proceed and finish.
8.2] Configuring MySQL:
Now that MySQL is installed on your system we can create a new database and a user to interact with it. You will have been prompted for a root password on installation. To log on to MySQL from the command line use the following line and then enter your password: ( mysql -u root -p )
Once you have logged in to the MySQL you can create a new database called securities_master and then select it: ( mysql> CREATE DATABASE securities_master; mysql> USE securities_master; )
Once you create a database it is necessary to add a new user to interact with the database. While you can use the root user, it is considered bad practice from a security point of view, as it grants too many permissions and can lead to a compromised system. On a local machine this is mostly irrelevant but in a remote production environment you will certainly need to create a user with reduced permissions. In this instance our user will be called sec_user. Remember to replace password with a secure password:
( mysql> CREATE USER ’sec_user’@’localhost’ IDENTIFIED BY ’password’; mysql> GRANT ALL PRIVILEGES ON securities_master.* TO ’sec_user’@’localhost’; mysql> FLUSH PRIVILEGES; )
The above three lines create and authorise the user to use securities_master and apply those privileges. From now on any interaction that occurs with the database will make use of the sec_user user.
8.3] Schema Design for EOD Equities:
We’ve now installed MySQL and have configured a user with which to interact with our database. At this stage we are ready to construct the necessary tables to hold our financial data. For a simple, straightforward equities master we will create four tables:
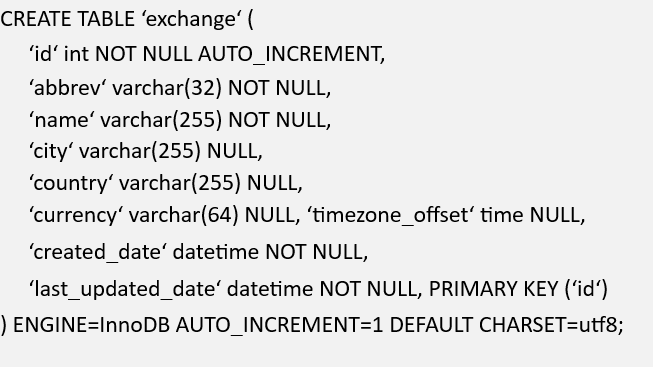
- Exchange – The exchange table lists the exchanges we wish to obtain equities pricing information from. In this instance it will almost exclusively be the New York Stock Exchange (NYSE) and the National Association of Securities Dealers Automated Quotations (NASDAQ).
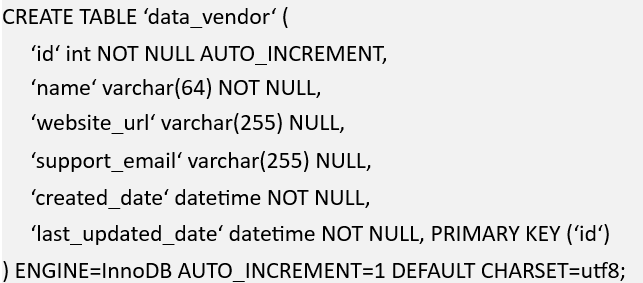
- DataVendor – This table lists information about historical pricing data vendors. We will be using Yahoo Finance to source our end-of-day (EOD) data. By introducing this table, we make it straightforward to add more vendors if necessary, such as Google Finance.
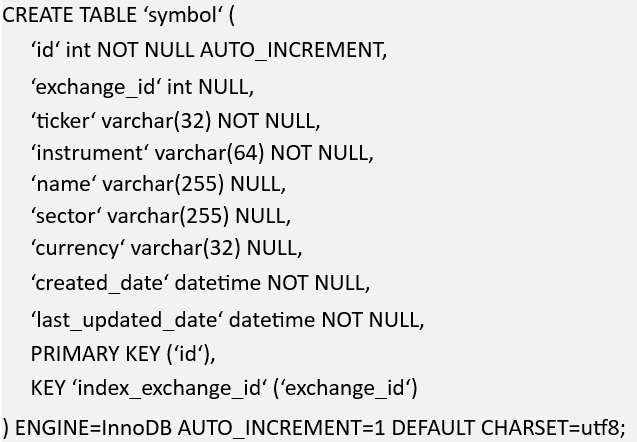
- Symbol – The symbol table stores the list of ticker symbols and company information. Right now we will be avoiding issues such as differing share classes and multiple symbol names.
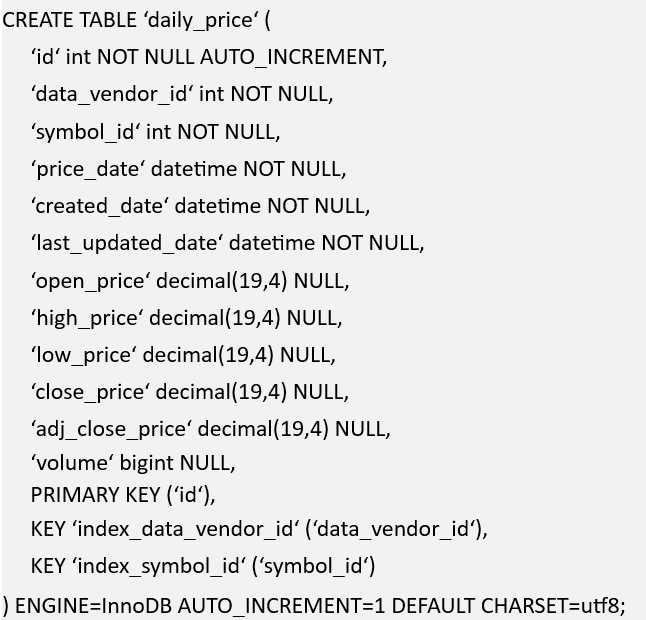
- DailyPrice – This table stores the daily pricing information for each security. It can become very large if many securities are added. Hence it is necessary to optimise it for performance.
MySQL is an extremely flexible database in that it allows you to customise how the data is stored in an underlying storage engine. The two primary contenders in MySQL are MyISAM and InnoDB. Although I won’t go into the details of storage engines (of which there are many!), I will say that MyISAM is more useful for fast reading (such as querying across large amounts of price information), but it doesn’t support transactions (necessary to fully rollback a multi-step operation that fails mid way through). InnoDB, while transaction safe, is slower for reads.
InnoDB also allows row-level locking when making writes, while MyISAM locks the entire table when writing to it. This can have performance issues when writing a lot of information to arbitrary points in the table (such as with UPDATE statements). This is a deep topic, so I will leave the discussion to another day!
We are going to use InnoDB as it is natively transaction safe and provides row-level locking. If we find that a table is slow to be read, we can create indexes as a first step and then change the underlying storage engine if performance is still an issue. All of our tables will use the UTF-8 character set, as we wish to support international exchanges.
Let’s begin with the schema and CREATE TABLE SQL code for the exchange table. It stores the abbreviation and name of the exchange (i.e. NYSE – New York Stock Exchange) as well as the geographic location. It also supports a currency and a timezone offset from UTC. We also store a created and last updated date for our own internal purposes. Finally, we set the primary index key to be an auto-incrementing integer ID (which is sufficient to handle 232 records):
Here is the schema and CREATE TABLE SQL code for the data_vendor table. It stores the name, website and support email. In time we can add more useful information for the vendor, such as an API endpoint URL:
Here is the schema and CREATE TABLE SQL code for the symbol table. It contains a foreign key link to an exchange (we will only be supporting exchange-traded instruments for the time being), a ticker symbol (e.g. GOOG), an instrument type (’stock’ or ’index’), the name of the stock or stock market index, an equities sector and a currency.
Here is the schema and CREATE TABLE SQL code for the daily_price table. This table is where the historical pricing data is actually stored. We have prefixed the table name with daily_ as we may wish to create minute or second resolution data in separate tables at a later date for higher frequency strategies. The table contains two foreign keys – one to the data vendor and another to a symbol. This uniquely identifies the data point and allows us to store the same price data for multiple vendors in the same table. We also store a price date (i.e. the daily period over which the OHLC data is valid) and the created and last updated dates for our own purposes.
The remaining fields store the open-high-low-close and adjusted close prices. Yahoo Finance provides dividend and stock splits for us, the price of which ends up in the adj_close_price column. Notice that the datatype is decimal(19,4). When dealing with financial data it is absolutely necessary to be precise. If we had used the float datatype we would end up with rounding errors due to the nature of how float data is stored internally. The final field stores the trading volume for the day. This uses the bigint datatype so that we don’t accidentally truncate extremely high volume days.
By entering all of the above SQL commands into the MySQL command line the four necessary tables will be created.
8.4] Connecting to the Database:
Before we can use MySQL with Python we need to install the mysqlclient library. mysqlclient is actually a fork of another library, known as Python-MySQL. Unfortunately the latter library is not supported in Python3 and so we must use mysqlclient. On Mac OSX/UNIX flavour machines we need to run the following commands: ( sudo apt-get install libmysqlclient-dev pip install mysqlclient )
We’re now ready to begin interacting with our MySQL database via Python and pandas.
8.5] Using an Object-Relational Mapper:
For those of you with a background in database administration and development you might be asking whether it is more sensible to make use of an Object-Relational Mapper (ORM). An ORM allows objects within a programming language to be directly mapped to tables in databases such that the program code is fully unaware of the underlying storage engine. They are not without their problems, but they can save a great deal of time. The time-saving usually comes at the expense of performance, however.
A popular ORM for Python is SQLAlchemy. It allows you to specify the database schema within Python itself and thus automatically generate the CREATE TABLE code. Since we have specifically chosen MySQL and are concerned with performance, I’ve opted not to use an ORM for this chapter.
Symbol Retrieval;
Let’s begin by obtaining all of the ticker symbols associated with the Standard & Poor’s list of 500 large-cap stocks, i.e. the S&P500. Of course, this is simply an example. If you are trading from the UK and wish to use UK domestic indices, you could equally well obtain the list of FTSE100 companies traded on the London Stock Exchange (LSE).
Wikipedia conveniently lists the constituents of the S&P500. Note that there are actually 502 components in the S&P500! We will scrape the website using the Python requests and BeautifulSoup libraries and then add the content directly to MySQL. Firstly make sure the libraries are installed: ( pip install requests pip install beautifulsoup4 )
The following code will use the requests and BeautifulSoup libraries to add the symbols directly to the MySQL database we created earlier. Remember to replace ’password’ with your chosen password as created above:
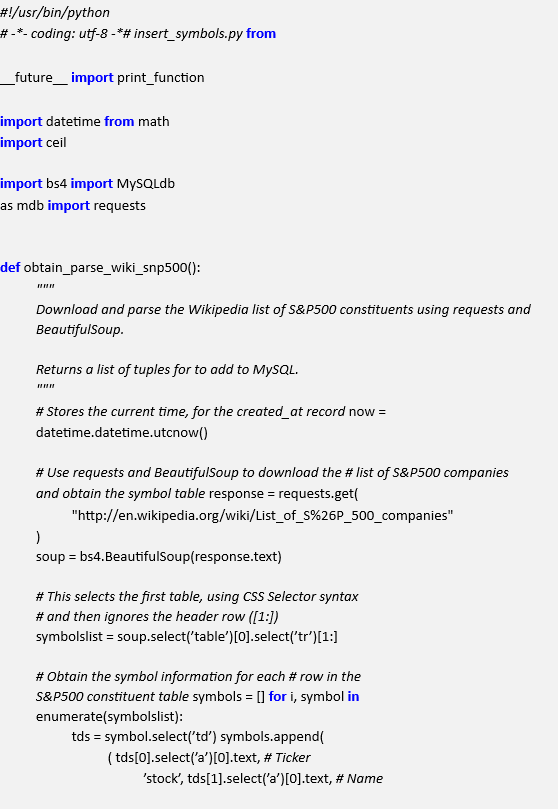
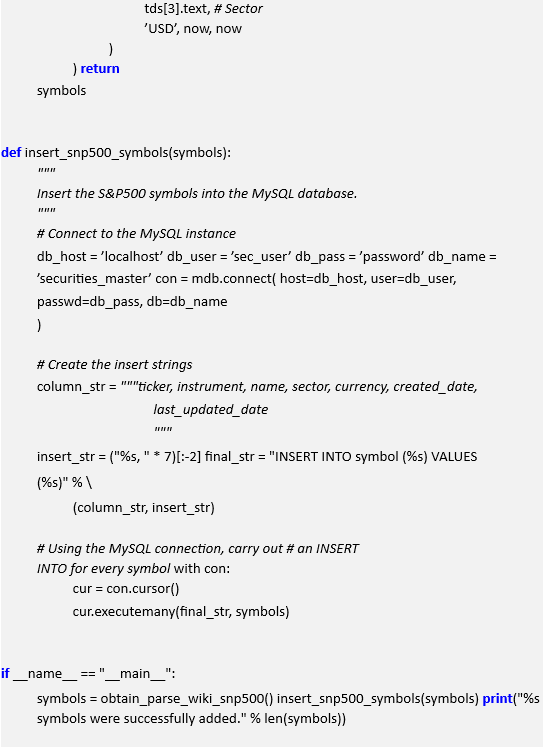
At this stage we’ll have all 502 current symbol constituents of the S&P500 index in the database. Our next task is to actually obtain the historical pricing data from separate sources and match it up the symbols.
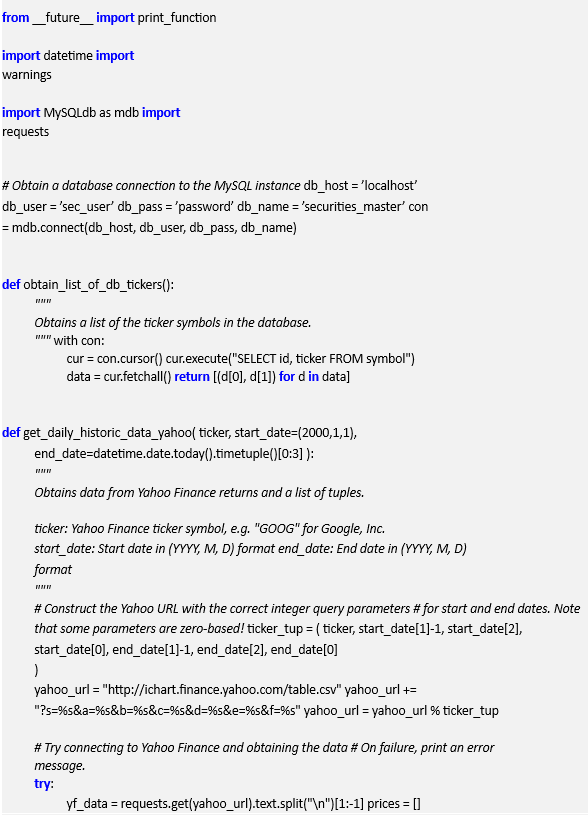
Price Retrieval;
In order to obtain the historical data for the current S&P500 constituents, we must first query the database for the list of all the symbols.
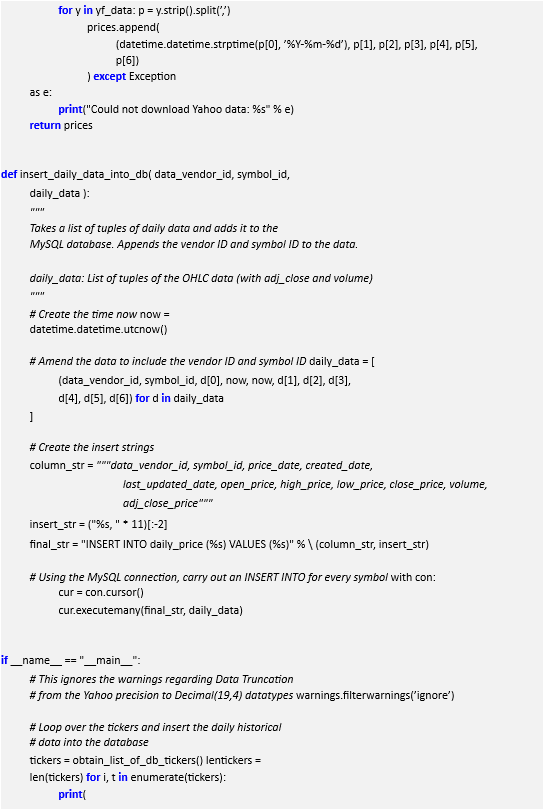
Once the list of symbols, along with the symbol IDs, have been returned it is possible to call the Yahoo Finance API and download the historical pricing data for each symbol.
Once we have each symbol we can insert the data into the database in turn. Here’s the Python code to carry this out:
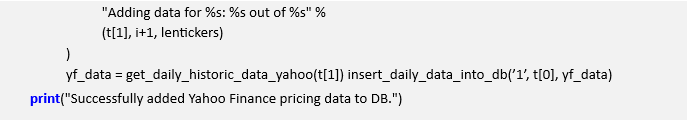
Note that there are certainly ways we can optimise this procedure. If we make use of the Python ScraPy library, for instance, we would gain high concurrency from the downloads, as ScraPy is built on the event-driven Twisted framework. At the moment each download will be carried out sequentially.
9.) Retrieving Data from the Securities Master
Now that we’ve downloaded the historical pricing for all of the current S&P500 constituents we want to be able to access it within Python. The pandas library makes this extremely straightforward. Here’s a script that obtains the Open-High-Low-Close (OHLC) data for the Google stock over a certain time period from our securities master database and outputs the tail of the dataset:
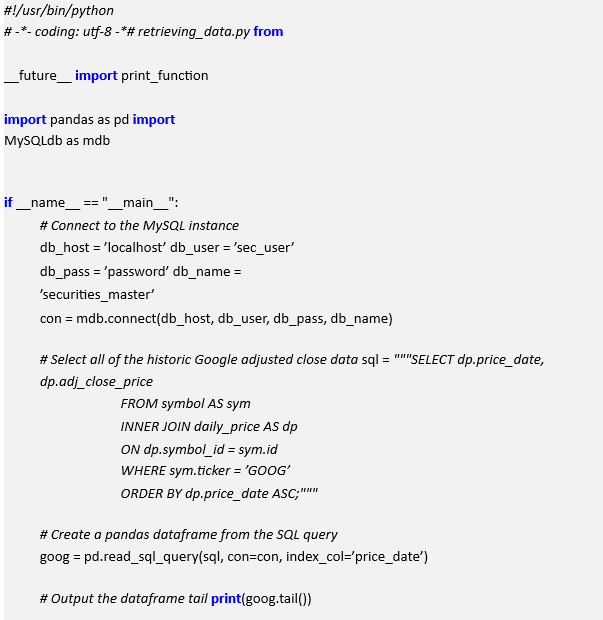
The output of the script follows:
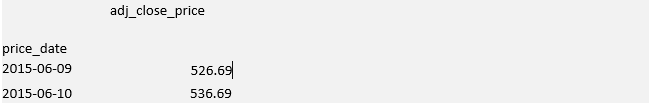

This is obviously only a simple script, but it shows how powerful having a locally-stored securities master can be. It is possible to backtest certain strategies extremely rapidly with this approach, as the input/output (I/O) speed from the database will be significantly faster than that of an internet connection.
Read Also; Zerodha Launches 6 New Kite Order Window Features